
Behind the Numbers: What Labor Data Can Tell Us About Turnover in Nebraska’s Child Care Workforce
by the Nebraska Department of Labor
Editor’s Note: The size of the child care workforce in Nebraska changed very little from the first quarter of 2025 to the first quarter of 2026: The year started with 12,020 workers and ended with 11,838. But these overall numbers hide a significant amount of disruption. During the same time period, 4,265 left the child care industry, while 4,083 new workers entered the industry. How should we understand, interpret and use this information? Workforce rates, such as hiring, turnover, retention and separation, are important indicators of the health of an industry.
In this blog post, the Nebraska Department of Labor (NDOL) explains how these indicators are measured and why comparing multiple indicators is important for understanding the child care industry as a whole.
An industry can end the year with about the same number of workers it had at the start. But that does not mean the workforce was stable. Many people may have left while many others were hired.
That movement matters. Employers spend time and money recruiting and training workers. Communities also need to know whether an industry is growing, shrinking or replacing people who leave. A single employment count cannot answer those questions.
The Nebraska Department of Labor (NDOL) uses longitudinal wage records to measure workforce movement over time. First Five Nebraska has used these industry rates in its regional child care reports. The same measures can be used for manufacturing, retail, healthcare, construction, or nearly any other industry.
The Child Care Services Industry
Child care employment data comes from quarterly wage reports submitted by all employers covered by unemployment insurance (i.e., liable employers) in the child care industry (North American Industry Classification System or NAICS code 624110). Liable employers exclude most self-employed and family-operated businesses, such as family child care home providers. Employers are categorized by industry code based upon the business’s primary activity. Organizations categorized in other industries that also offer child care services are not included in the data (e.g., schools, local government, community advocacy or religious organizations). As a result, data from the child care services industry represent a segment of the child care workforce.
Four Rates Tell One Workforce Story
NDOL compares workers employed in a specific quarter of one year with workers employed in the same quarter of the next year. Statewide Nebraska data for the child care services industry shows how the calculations fit together.
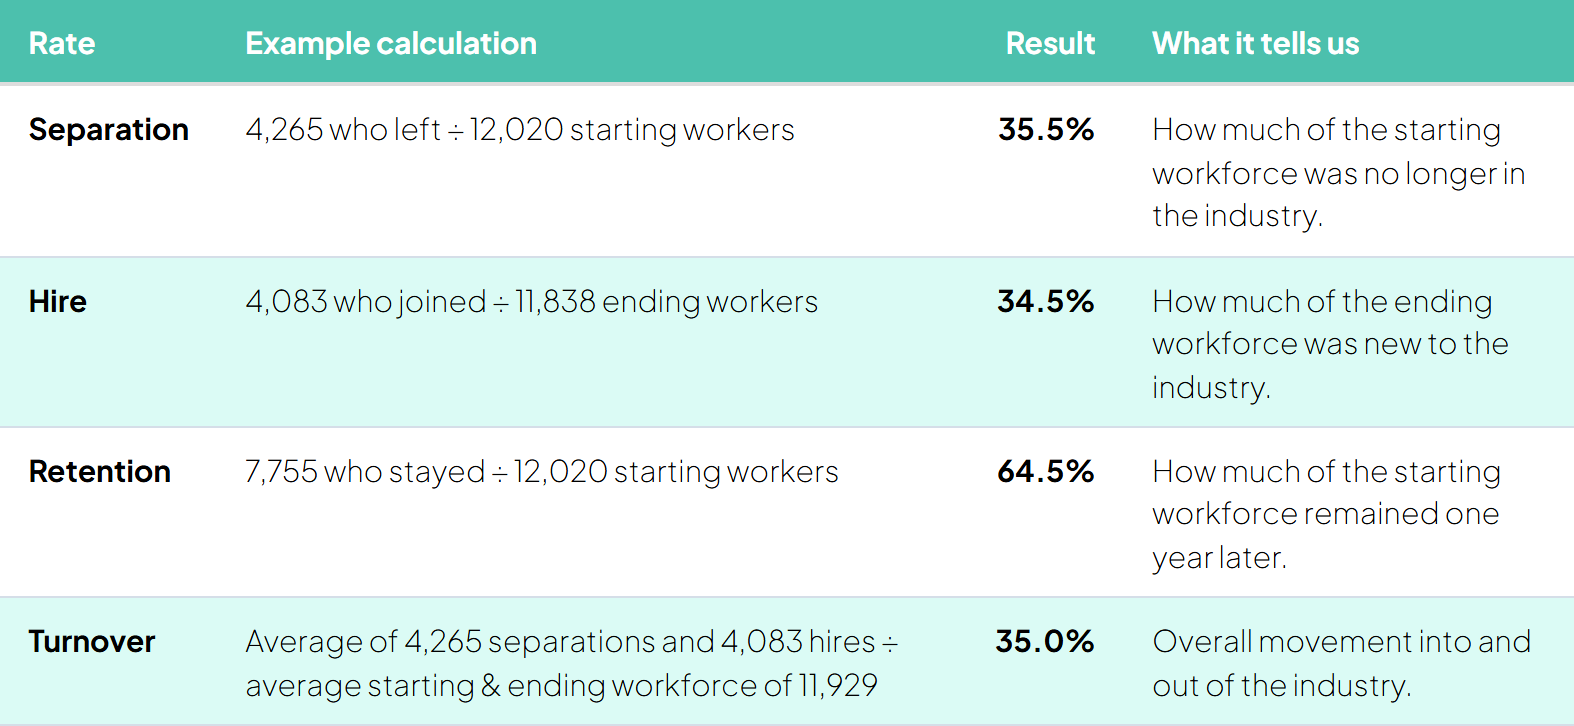
The Nebraska child care services industry had 12,020 workers in first quarter 2025 and 11,838 in first quarter 2026, a net loss of 182 workers. However, the net change does not reflect the movement of individuals in and out of the child care industry over the year. Of the 12,020 workers in the starting quarter, 4,265 were no longer employed in the industry a year later. In addition to the 7,755 individuals who remained employed in the child care industry, 4,083 new child care workers were hired. These figures can all be used to calculate rates related to the industry workforce.

Definitions
T0: Initial quarter of employment, count
of unique Social Security Numbers (SSNs).T1: Final quarter of employment, count
of unique SSNs.Union: Count of employment in T0 and T1
Separations: T0 – Union
Hires: T1 – Union
Read the Rates Together
Each rate answers a different question. The clearest picture comes from looking at the pattern they create together.
High hiring and high separation. Employers may be hiring often just to replace workers who leave. This can indicate a relatively high turnover industry that is not growing.
High hiring and low separation. The industry may be adding jobs and expanding its workforce.
Low hiring and low separation. The workforce may be stable with relatively low turnover but is not growing.
Low hiring and high separation. The industry may be losing workers faster than it can replace them. This can be the sign of a declining industry and/or a lack of available workers with the necessary skills.
Turnover helps summarize movement in both directions. It averages hires and separations, then compares that movement with the industry's average workforce size. This keeps growth or decline from being confused with worker movement.
With a 35.5% separation rate and a 34.5% hiring rate, child care services fit into the high hiring and high separation category. The overall movement into and out of the industry, or turnover, is at 35.0%.
Why Compare the Same Quarter?
Employment can rise or fall during the year because of weather, school schedules, holidays, tourism or other seasonal patterns. Comparing a specific quarter with the same quarter a year later reduces that seasonal noise. It also creates a consistent yearly measure that works well for planning and for comparing industries or regions. If seasonality is not a concern, quarter-to-quarter comparisons can also be made.
What the Rates Do Not Show
A separation does not always mean someone becomes unemployed. A worker may have moved to another industry, left Nebraska employment, retired, stopped working or started a job not covered by unemployment insurance such as self-employment and some family-operated businesses. Wage records show where a person worked, but not why the person stayed or left.
The annual comparison also misses some short-term movement. Some employees only work in specific months—such as students who work during the summer—and may show up in the retention rate or not be included at all, depending on which comparison quarters are used. The annual rates show broad workforce stability, not every hire and separation during the year.
A Fuller Picture of Workforce Change
Employment totals remain useful, but they are only the starting point. Separation, hire, retention and turnover rates show the movement behind the total. Together, they help employers, workforce programs, researchers and community leaders better understand the health of an industry.
Source: Nebraska Department of Labor, Nebraska Longitudinal Data System, Industry Turnover Rates, 2020–21 through 2025–26.